Author: David Templeton, CFA, Principal and Portfolio Manager
For nearly three trading weeks the S&P 500 Index has traded mostly sideways, somewhat expected after the fast start to 2021, i.e., the S&P 500 Index up over 11% through the end of April. Under the surface though the trading has not been so subdued. Several important trends are taking place investors might want to take note of. First of all the so-called FANG trade has lagged the broader market since the beginning of September. The below chart displays the FANGMA stocks, i.e., Facebook (FB), Amazon (AMZN), Netflix (NFLX), Alphabet (GOOGL), Microsoft (MSFT) and Apple (AAPL) compared to the S&P 500 Index since September 1, 2020. The only FANGMA stock beating the Index is Alphabet with the other FANGMA stocks trailing the S&P 500 Index by double digits.
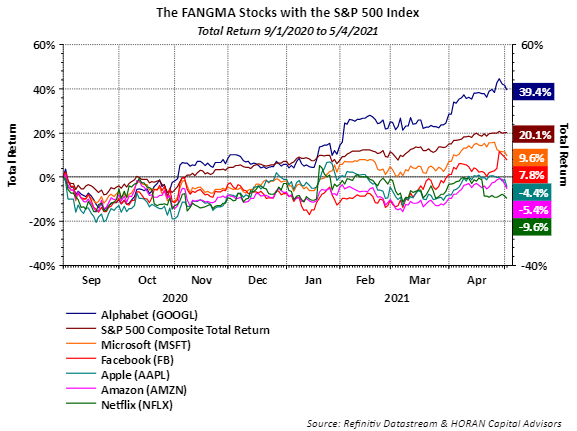
These mega cap growth stocks have been a favorite of investors for the last eight or more years with each outperforming the broader market S&P 500 Index by a wide margin. With the FANGMA's lagging the market now, a rotation seems to be underway.
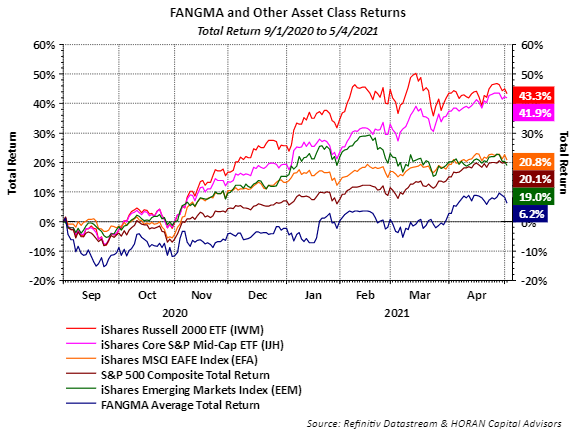
In the chart below the blue line represents the average return of these six FANGMA stocks compared to some additional asset classes. The red line on the chart represents the small cap iShare Russell 2000 ETF (IWM) and the pink line is the iShare Core S&P Mid-Cap ETF (IJH). Both of these asset classes are far outpacing the average return of the FANGMA basket and outpacing the S&P 500 Index. This type of rotation is healthy for the market as a broader group of stocks are participating in the market's move higher.
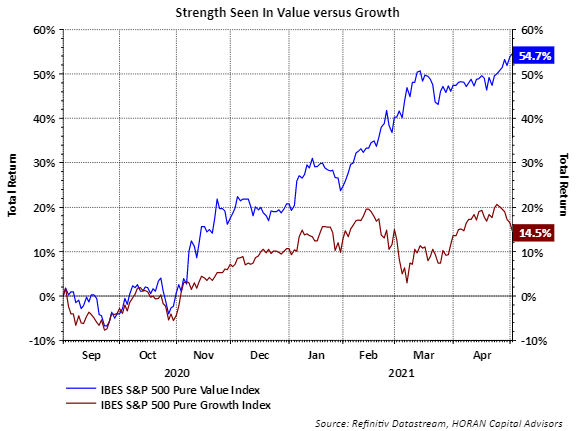
The stocks in the FANGMA basket tend to be classified as growth stocks versus value stocks. Since the end of the 2008/2009 financial crisis, pure growth stocks have outperformed pure value. Again, since September 1, 2020, the Pure Value Style (RPV) has far outpaced Pure Growth (RPG). The below chart clearly shows this with the S&P 500 Pure Value Index returning 54.7% versus the Pure Growth Index counterpart returning14.5%.
As it relates to value versus growth performance one question becomes is this rotation to value and its outperformance sustainable and the start of a longer-term trend. Without having a clear crystal ball, where the economy seems to be in the economic cycle can provide some clarity. We do believe the economy has exited the recession and is in a part of the business cycle where value has historically outperformed growth as I have written about in the past in an article titled, Why It Matters Value Stocks Are Outperforming Growth Stocks.
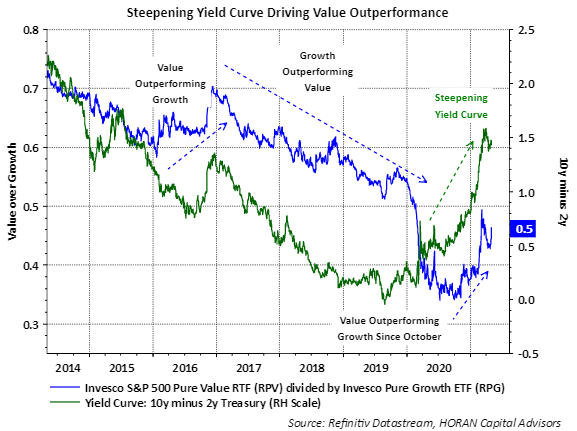
Another variable that can lead to value outperformance is the direction of interest rates as seen in the below chart. As longer-term rates rise and the yield curve steepens, this typically is a common occurrence as the economy exits a recession. And with higher longer-term interest rates, this can create a headwind for growth stocks since their more distant earnings and cash flow are worth less as they are discounted forward at higher interest rates. The below chart shows this steeper yield curve relationship. As the yield curve has steepened, value has mostly outperformed growth and has taken hold since October of 2020.
In conclusion, interest rate pressure to the upside is wanting to take hold as the inflation discussion increasingly makes headlines. Much of this inflation pressure seems to be due to tight inventories coming out of the pandemic shutdown. The overused term is the current inflation is transitory. The pent-up demand will get satisfied and maybe a lot of it not until mid-year next year. However, we do not believe significant inflation takes hold longer term, at least at this point in time.
HORAN Capital Advisors, LLC is an SEC registered investment advisor. The information herein has been obtained from sources believed to be reliable but we cannot assure its accuracy or completeness. Neither the information nor any opinion expressed constitutes a solicitation for the purchase or sale of any security. Any reference to past performance is not to be implied or construed as a guarantee of future results. Market conditions can vary widely over time and there is always the potential of losing money when investing in securities. HCA and its affiliates do not provide tax, legal or accounting advice. This material has been prepared for informational purposes only and is not intended to provide and should not be relied on for tax, legal or accounting advice. You should consult your own tax, legal and accounting advisors before engaging in any transaction.