
Author: David I. Templeton, CFA, Principal and Portfolio Manager
The supposed recession that took place during the COVID/pandemic shutdown in 2020 caught nearly everyone by surprise. Fortunately, the economy and investment markets made a sharp and quick recovery. At the moment though, some variables are beginning to align that might be a sign of a recession on the horizon. Below are six charts one can track to provide some insight on whether the economy might be headed for a recession or not.
Since 1950 (or 1960 in some cases) every U.S. recession has been preceded by,
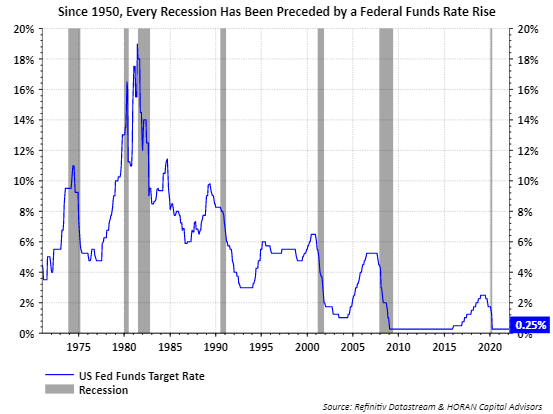
- A rise in the Federal Funds Rate
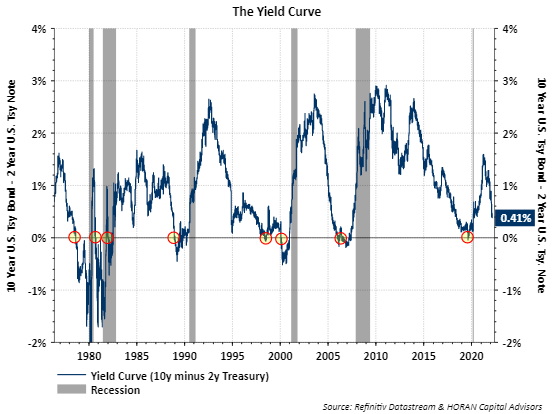
- An inverted yield curve
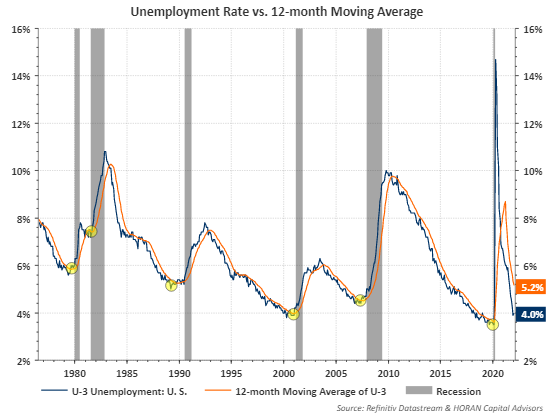
- Unemployment rate rises above its 12-month moving average
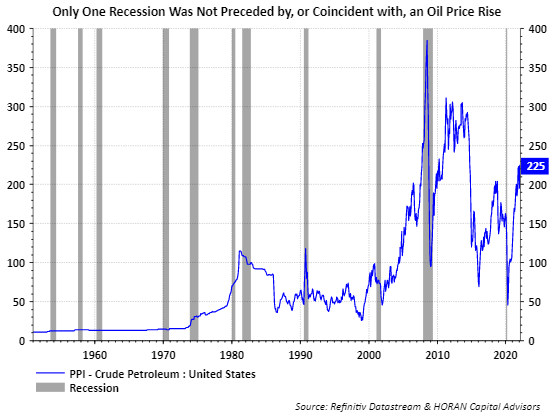
- Increasing oil prices, and
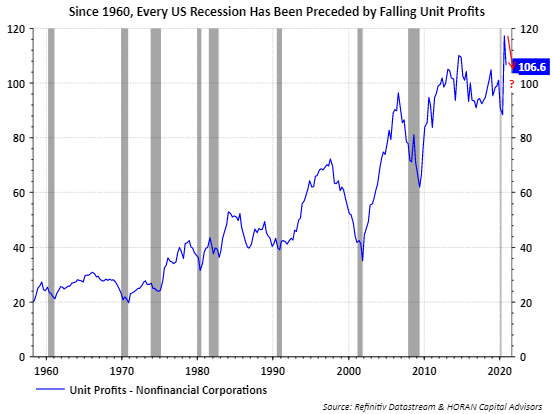
- Falling unit profits for US nonfinancial companies
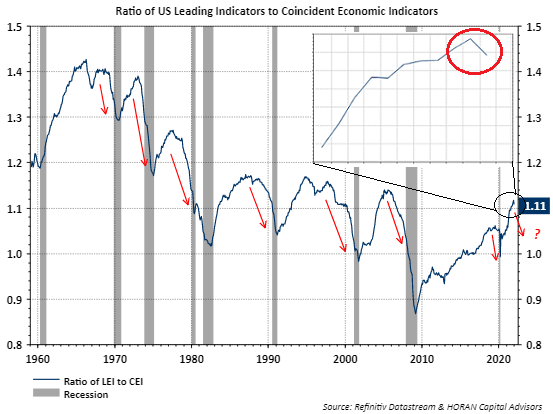
- Falling ratio of Conference Board's Leading Index to Coincident Index
The first three bullet points above have not occurred as of yet while the last three have triggered.
No increase in the Fed Funds Rate, yet:
- Up until the Russian invasion into Ukraine, the market was nearly unanimous in thinking the Federal Reserve would increase the Fed Funds Rate by at least .25%, if not .50%. The Ukraine/Russia geopolitical issue has raised doubt about a rate increase, however, at least a 25 basis point Fed Funds Rate increase seems plausible at the March meeting.
Yield curve not inverted but the curve is flattening:
- Since 1950, every recession in the U.S. has been preceded by an inversion of the treasury yield curve. This occurs when the 2-year Treasury yield becomes greater than the yield on a 10-year treasury Bond. At the end of March, 2021 the spread between the 2- and 10-year Treasury had widened to 159 basis points or 1.59 percentage points. As the below chart shows, the spread has narrowed to 41 basis points as the yield curve has flattened. Higher short term rates relative to longer term rates have the impact of slowing the economy, i.e., the Fed is reducing monetary support of the economy and higher short term rates tend to discourage bank lending.
Unemployment rate remains below its 12-month moving average:
- With this indicator, as the economy slows, or companies anticipate a slowing economy, they reduce there workforce in anticipation of slower business activity. This causes the unemployment rate to rise more quickly and and cross above its 12-month moving average. Again, this measure can foretell an economic slowdown.
Increasing oil prices are a reality at the moment:
- There are many reason for the dramatic rise in oil prices, some self inflected by the U.S. Nonetheless, higher energy prices take money out of consumers' pockets. With consumers accounting for 70% of economic activity, if they have less discretionary funds to spend as a result of spending more on energy related items, this tends to contribute to a slowing of the economy. As this is post is being written, NYMEX Light Crude is nearly $108/bbl, up from $60/bbl a year ago.
Nonfinancial corporate profits beginning to turn lower:
- The below chart shows unit profits declined in the third quarter of 2021. The Bureau of Labor Statistics will release updated figures for the fourth quarter on March 3 and this will provide important insight into the trend for unit profits.
The ratio of the Conference Board's Leading Economic Index (LEI) to the Coincident Economic Index (CEI) has turned lower:
- The Conference Board's LEI declined in January while the CEI rose which suggests the economy could see some weakness looking out six or so months. Historically, a downturn in this ratio can occur any where from six months to several years before a recession unfolds. As with the other indicators, they need to be reviewed and evaluated as a group.
Higher energy cost has a fairly quick negative impact on economic activity as it feeds into higher inflation. With the supply chain issues resulting from the pandemic shutdown also influencing inflation, the consumer is facing a stiff headwind as it relates to higher prices. With the abundance of energy reserves in the U.S., policies should be pursued that leverage U.S. energy resources to mitigate the negative impact of higher energy costs. The recent geopolitical events, i.e., Russia/Ukraine, certainly warrant a harder look at the energy policy being pursed in the U.S at the moment. At the end of the day, following the above six charts can provide some clues on the future direction of the U.S economy.
HORAN Capital Advisors, LLC is an SEC registered investment advisor. The information herein has been obtained from sources believed to be reliable but we cannot assure its accuracy or completeness. Neither the information nor any opinion expressed constitutes a solicitation for the purchase or sale of any security. Any reference to past performance is not to be implied or construed as a guarantee of future results. Market conditions can vary widely over time and there is always the potential of losing money when investing in securities. HCA and its affiliates do not provide tax, legal or accounting advice. This material has been prepared for informational purposes only and is not intended to provide and should not be relied on for tax, legal or accounting advice. You should consult your own tax, legal and accounting advisors before engaging in any transaction.