
Author: David I. Templeton, CFA, Principal and Portfolio Manager
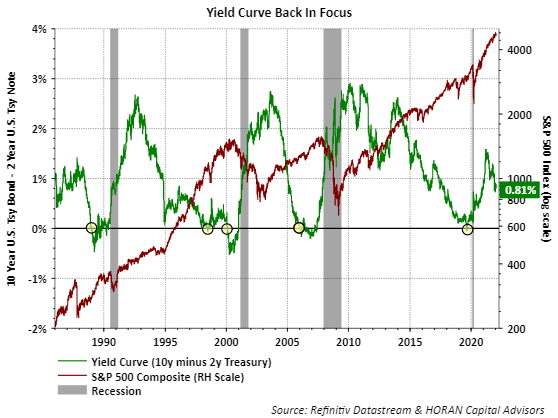
The Federal Reserve has put the market on notice that interest rate increases are likely to come sooner than originally anticipated as well as an unwinding of the Fed's balance sheet. With this being the case, the shape/slope of the yield curve, the 10-year Treasury yield minus the 2-year Treasury yield, is one variable investors should keep an eye on as the year progresses. Historically, when short term rates rise above long term rates a recession has followed. I discussed this in a 2018 article, Respect The Predictive Power Of An Inverted Yield Curve, where I highlighted a comment from a paper from the Federal Reserve Bank of San Francisco,
"Every U.S. recession in the past 60 years was preceded by a negative term spread, that is, an inverted yield curve. Furthermore, a negative term spread was always followed by an economic slowdown and, except for one time, by a recession. While the current environment is somewhat special—with low interest rates and risk premiums—the power of the term spread to predict economic slowdowns appears intact."
The decline in the green line in the below chart means the yield curve is flattening, i.e., short rates are moving closer to long term rates. The spread between the 2-year yield and 10-year yield is now down to .81 percentage points or 81 basis points, down from 1.58 percentage points in March 2021.
As the third week of January gets underway, recent market volatility has not done too much damage to the market indices themselves. The S&P 500 Index is down just 2.17%, the S&P 400 Mid Cap Index down 2.16% and the S&P 600 Small Cap Index is down .96%. This minor drop in the overall indices does not tell the whole story though. When looking at the individual holdings in the respective indexes, for the S&P 500 Index, 47%, or nearly half of them are down more than 10% with 18% down greater than 20%. The average decline for the holdings puts them in correction territory, i.e., down 11.7%. Similar, yet worse results are evident in the mid cap and small cap indices. In the S&P 600 Small Cap Index, 68% of the index holdings are down over 21% with 43% or 262 stocks down greater than 20%.
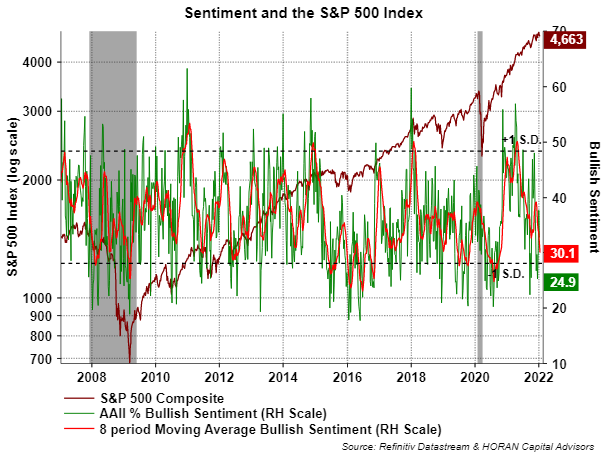
The fact the underlying damage in the indexes is telling a much different story than the overall index returns themselves has not gone unnoticed by investors. The most recent Sentiment Survey report from the American Association of Individual Investors shows bullish individual investor sentiment has declined to 24.9%. This is an overly pessimistic level, and being a contrarian indicator, historically associated with an equity market bounce.
Interestingly, and although the overall index declines are not significant themselves, the below chart shows the 12-month forward return associated with various bullish sentiment levels. At lower readings like the current 24.9%, 12-month forward returns tend to be favorable.
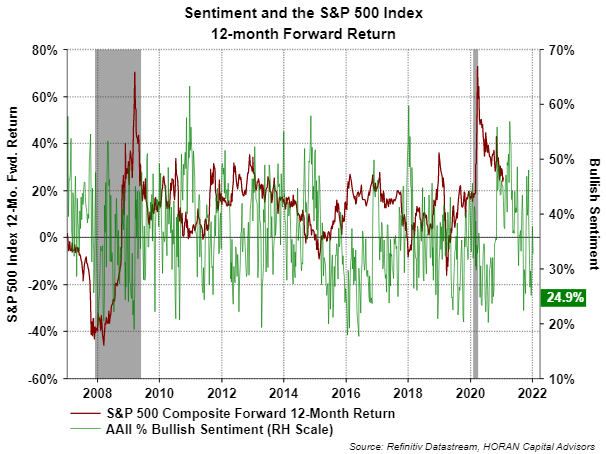
As I often note, the equity markets do not move higher in a straight line and the broader indices are not down much from their highs; however, individual investor sentiment is leaning towards overly bearish. At a minimum, this level of sentiment has historically, mostly been associated with equity market bounces. More factors are at play right now, the fact the Federal Reserve appears intent on raising short term rates this year, fourth quarter 2021 earnings reporting season getting into full swing and it being a mid-term election year, all will add to the potential for an elevated level of market volatility this year.
HORAN Capital Advisors, LLC is an SEC registered investment advisor. The information herein has been obtained from sources believed to be reliable but we cannot assure its accuracy or completeness. Neither the information nor any opinion expressed constitutes a solicitation for the purchase or sale of any security. Any reference to past performance is not to be implied or construed as a guarantee of future results. Market conditions can vary widely over time and there is always the potential of losing money when investing in securities. HCA and its affiliates do not provide tax, legal or accounting advice. This material has been prepared for informational purposes only and is not intended to provide and should not be relied on for tax, legal or accounting advice. You should consult your own tax, legal and accounting advisors before engaging in any transaction.