
Author: David I. Templeton, CFA, Principal and Portfolio Manager
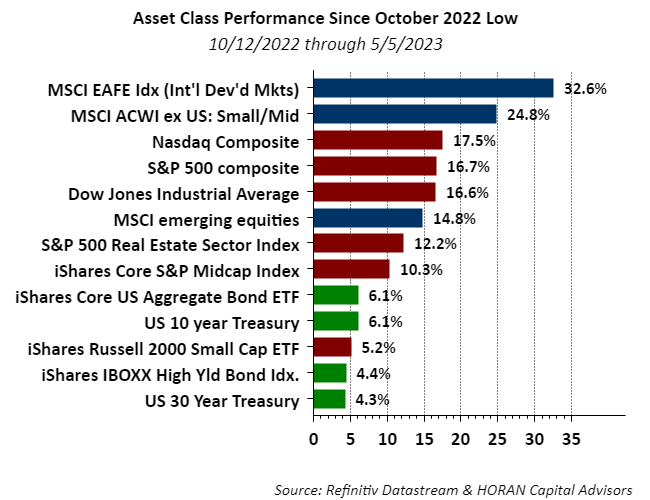
Although 2022 was not a good year for most investment asset classes a recovery in equities actually began early in the fourth quarter of the year. The S&P 500 Index was up 7.56% in the fourth quarter of 2022 and the positive equity performance carried over into 2023 with the index up 7.50% in the first quarter. The blue- and maroon- colored bars displayed in the below chart represent equity-oriented indexes, with the blue bars representing international focused ones and the maroon representing U.S. oriented indexes. As can be seen most all the equity indexes are outperforming the fixed income-oriented ones (green bars) since the October 12, 2022 low in the S&P 500 Index. Particulary strong performance has occurred in markets outside the U.S. with the developed markets MSCI EAFE Index up 32.6% since October.
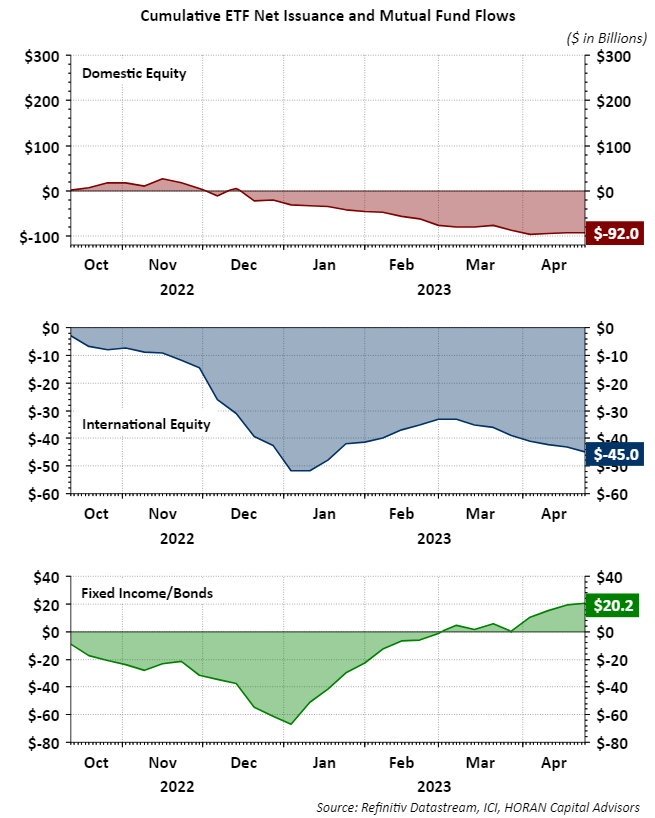
During this same time period though, fund flows into equity mutual funds and ETF's have been negative. So just as stocks were set to rebound, investors have been reducing equity exposure as seen below. Positive investment flows have occurred in fixed income as bond returns began to improve late last year as well, but the better performing equity asset classes are seeing fund outflows.
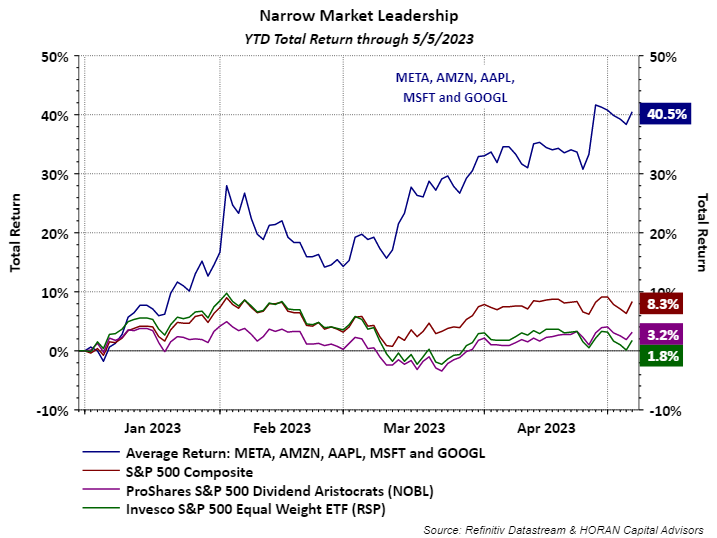
Lastly, a little more than four months into 2023 U.S. equity returns have been driven by a narrow group of stocks. The below chart shows the average return of five larger market cap stocks, Meta Platforms (META), Amazon (AMZN), Apple (AAPL), Microsoft (MSFT) and Google (GOOGL), have far outpaced the broader market. This group of five stocks is up over 40% this year while the S&P 500 Index total return is 8.3%. The return of the average stock in the S&P 500 Index is just 1.8% as represented by the Invesco S&P 500 Equal Weighted Index (RSP), green line on the chart.
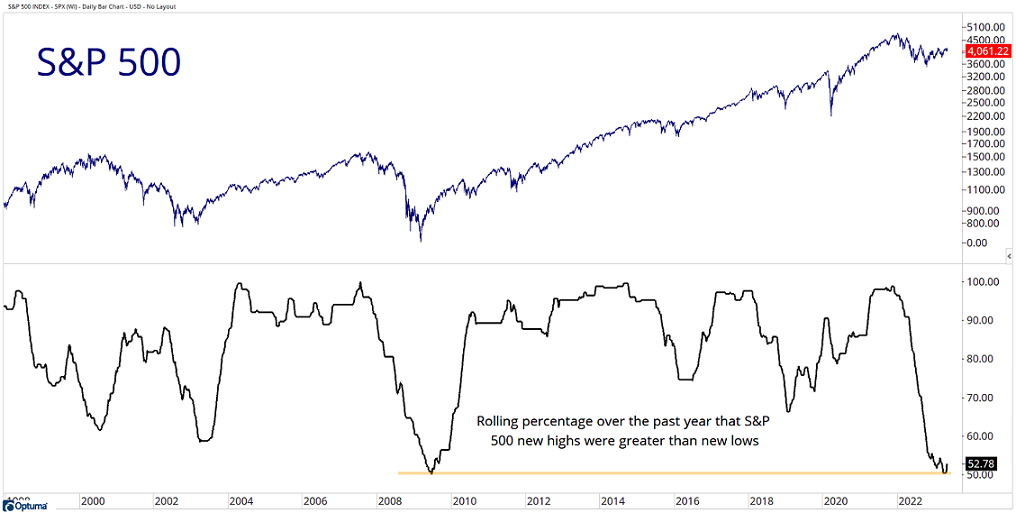
It would be constructive for the market to see a broader group of stocks participate in this market advance. One technical measure displayed in the below chart shows the rolling percentage over the past year of S&P 500 stock new highs less new lows (chart source). The last time this percentage was at this low of a level was in 2009, the low in the great financial crisis. Not that history plays out exactly as in the past, it can rhyme.
HORAN Capital Advisors, LLC is an SEC registered investment advisor. The information herein has been obtained from sources believed to be reliable but we cannot assure its accuracy or completeness. Neither the information nor any opinion expressed constitutes a solicitation for the purchase or sale of any security. Any reference to past performance is not to be implied or construed as a guarantee of future results. Market conditions can vary widely over time and there is always the potential of losing money when investing in securities. HCA and its affiliates do not provide tax, legal or accounting advice. This material has been prepared for informational purposes only and is not intended to provide and should not be relied on for tax, legal or accounting advice. You should consult your own tax, legal and accounting advisors before engaging in any transaction.