Author: David Templeton, CFA, Principal and Portfolio Manager
With the month of July now closed for the market, the S&P 500 Index is up 17.99% in the first seven months of the year. This strong performance is on top of the market's 18.40% return in 2020. Last year's return was a surprise to some given the February to March 2020 decline of 33.92% as a result of the pandemic shutdown. It is understandable then that some investors might expect the market needs to digest these strong returns through either a market pullback or with the market trading sideways over a period of time. This would be a normal occurrence for the market.
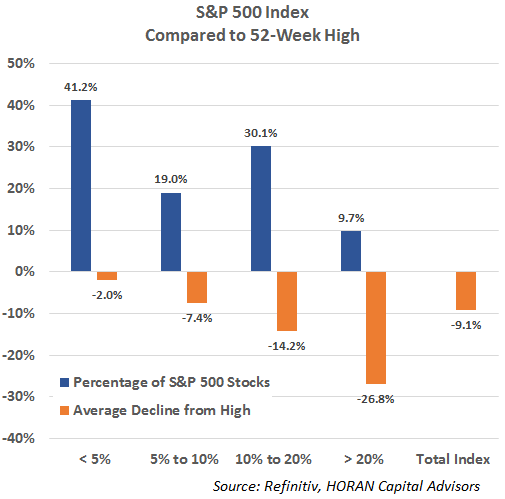
Although the S&P 500 Index is only down .61% from its recent high, under the surface, a large number of stocks have seen significant drawdowns from their own 52-week highs. For the S&P 500 Index nearly 40% of the index's stocks are down greater the 10% and the average decline for stocks from their 52-week highs is 9.1%.
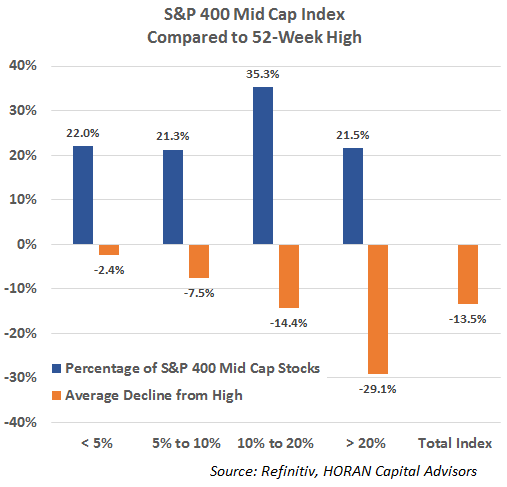
Other indexes have seen an even larger number of stocks with significant declines from their highs. The following two charts show detail for the S&P 400 Mid Cap Index and the S&P 600 Small Cap Index.
The mid cap index is down 2.40% from its high yet the average decline for the stocks in the index is 13.5% and nearly 57% of the stocks are down more than 10%.
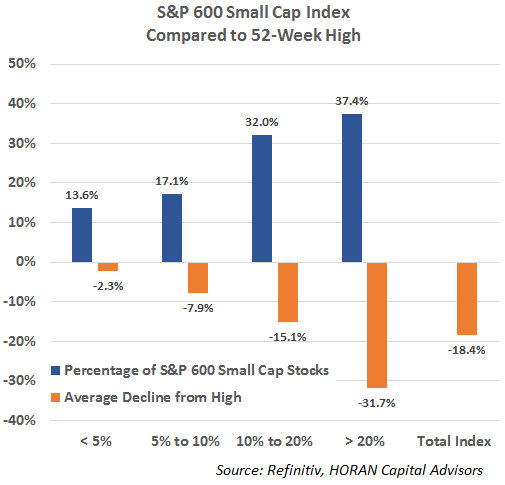
The S&P 600 Small Cap Index has seen even broader weakness with almost 70% of the index's stocks down more than 10% from their 52-week highs. The percentage of stocks down more than 20% is 37.4% with the average decline equaling 31.7%. The small cap index is down 5.15% from its high and the average decline of the stocks in the index from their 52-week high is 18.4%.
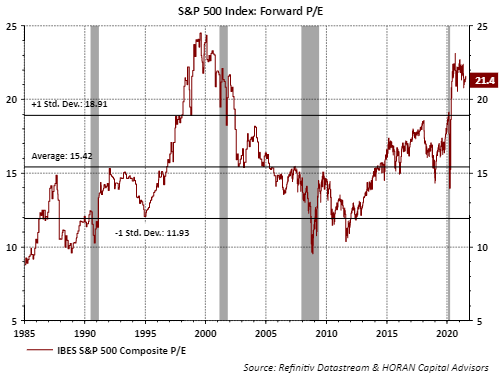
This broader weakness in the index holdings themselves is reflective of a correction occurring under the surface of the indexes. This under the surface corrective action might prevent a more severe correction from occurring near term, keeping in mind corrections are a normal action for equity markets. Equity valuations are elevated, but in a low interest rate environment, it makes sense that stocks can trade at higher forward valuations or P/E's.
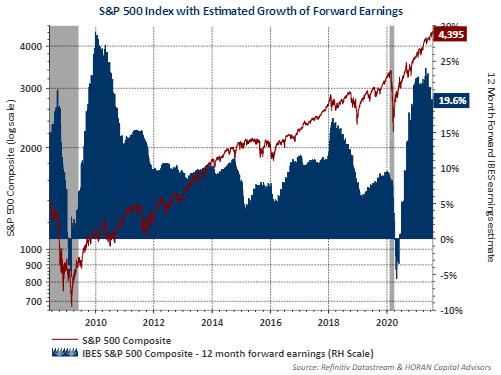
Also supportive of higher valuations is the strength in earnings growth expectations looking forward for the next 12-months. I/B/E/S earnings growth expectations into mid year 2022 remain a high 19.6%. All else being equal, this is positive for stocks.
I will sound like a broken record but stocks do not move higher in a straight line and the market does not like negative surprises. Yet, the underlying corporate fundamentals appear strong and are supportive of the current market, knowing a correction can occur at anytime.
HORAN Capital Advisors, LLC is an SEC registered investment advisor. The information herein has been obtained from sources believed to be reliable but we cannot assure its accuracy or completeness. Neither the information nor any opinion expressed constitutes a solicitation for the purchase or sale of any security. Any reference to past performance is not to be implied or construed as a guarantee of future results. Market conditions can vary widely over time and there is always the potential of losing money when investing in securities. HCA and its affiliates do not provide tax, legal or accounting advice. This material has been prepared for informational purposes only and is not intended to provide and should not be relied on for tax, legal or accounting advice. You should consult your own tax, legal and accounting advisors before engaging in any transaction.