
Author: David I. Templeton, CFA, Principal and Portfolio Manager
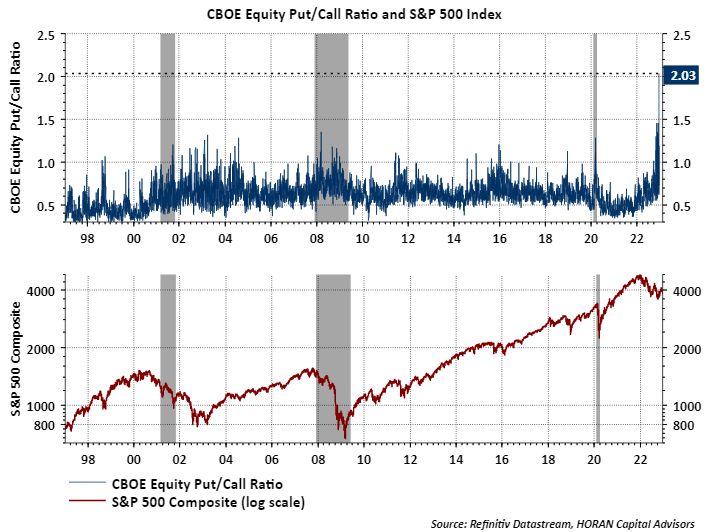
A few weeks ago I wrote an article covering the elevated level of the CBOE Equity Put/Call ratio and the fact it was in uncharted territory. At the time of that writing the P/C ratio equaled 1.46. On Wednesday the ratio reached an astounding 2.03! The put/call ratio is a contrarian measure, and the significance of this high P/C ratio level is the fact at extremes, i.e., levels above 1.0, it is a signal that individual investors are overly bearish on the equity market.
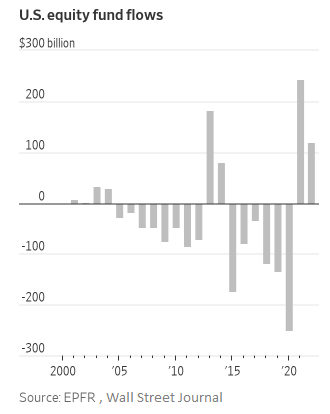
Then this past weekend the Wall Street Journal published an article, Individual Investors Hang On in Wild Year for Stocks While Pros Sell ($$), that noted individual investors continued to add to their stock investments while the "pros" were selling. The below chart was included in the article and it does show investor equity flows have been positive in the last two years. But looking to the left on the chart, individual investor fund flows have been mostly negative.
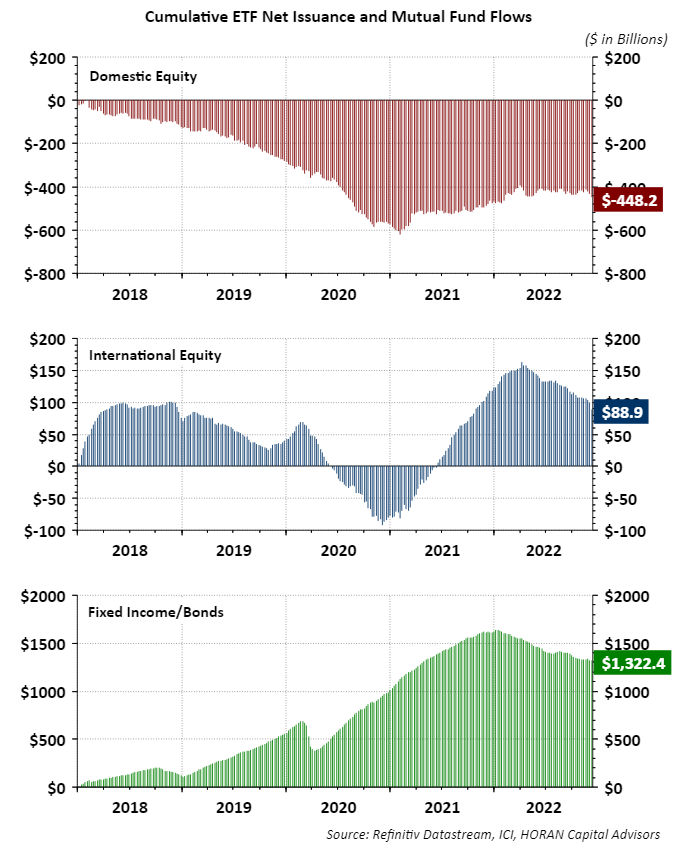
And to that point, below is a chart showing cumulative flows into exchange traded funds and mutual funds going back to 2018. Clearly, individual investors have reduced equity exposure over this time period to the tune of $-448.2 billion for U.S. equity. Fixed income or bonds have been the biggest beneficiary of investor flows during this nearly five-year stretch with investors adding a cumulative $1.3 trillion dollars. With cumulative equity flows being negative, it is possible individual investors are underweight equity and now beginning to increase their exposure given the pullback in equities this year.
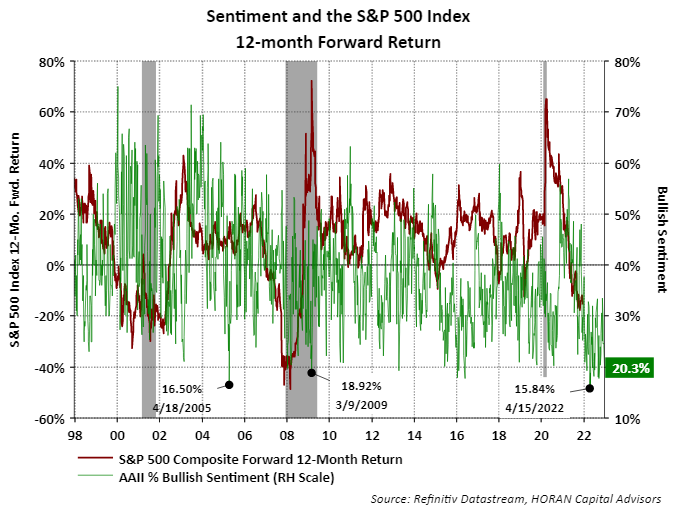
In looking at another variable that measures investor sentiment, today the American Association of Individual Investors' Sentiment Survey noted investors remain decidedly bearish. The bull/bear ratio was reported at -32 and was last positive in April of this year. Also, in the Sentiment Survey, investor bullishness fell to 20.3%, another extreme level. Notable though and shown in the below chart, forward 12-month S&P 500 returns historically have generated their best results when the bullish sentiment reading reaches a low level.
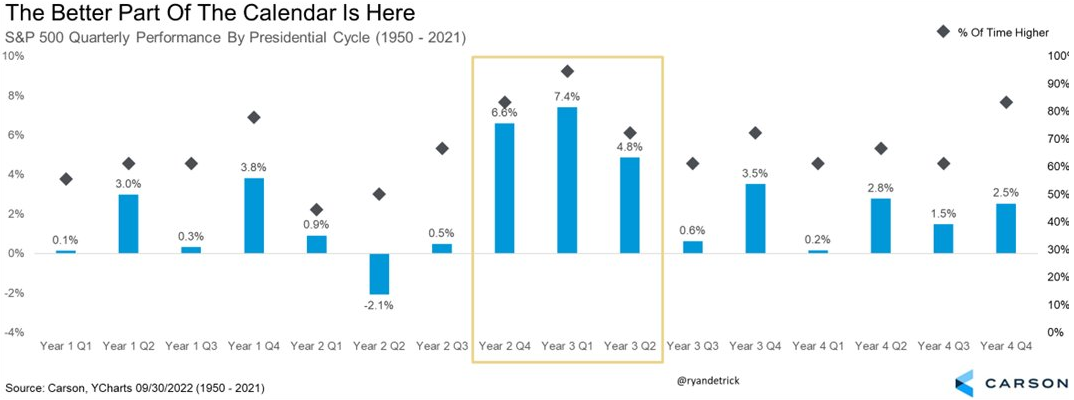
Lastly, market pessimism among strategist also seems to be the norm regarding returns in the first half of 2023. Ryan Detrick, Chief Market Strategist at Carson Group, recently highlighted this same issue. Everyone seems to be leaning in the same direction and one aspect of the equity market is it likes to run counter to the consensus. To that fact, Ryan Detrick prepared the below chart that shows since 1950 first quarter returns in a preelection year have been the strongest, averaging 7.4% and positive 17 out of 18 of the years.
In conclusion, headwinds can be cited for weaker equity returns in the year ahead. However, if there is some truth that markets are efficient, and known information is reflected in current equity prices, maybe current equity levels reflect the broad bearish views of investors. In other words, the contrarian view could play out where equity returns are favorable in the first half of the coming year.
HORAN Capital Advisors, LLC is an SEC registered investment advisor. The information herein has been obtained from sources believed to be reliable but we cannot assure its accuracy or completeness. Neither the information nor any opinion expressed constitutes a solicitation for the purchase or sale of any security. Any reference to past performance is not to be implied or construed as a guarantee of future results. Market conditions can vary widely over time and there is always the potential of losing money when investing in securities. HCA and its affiliates do not provide tax, legal or accounting advice. This material has been prepared for informational purposes only and is not intended to provide and should not be relied on for tax, legal or accounting advice. You should consult your own tax, legal and accounting advisors before engaging in any transaction.