
Author: David I. Templeton, CFA, Principal and Portfolio Manager
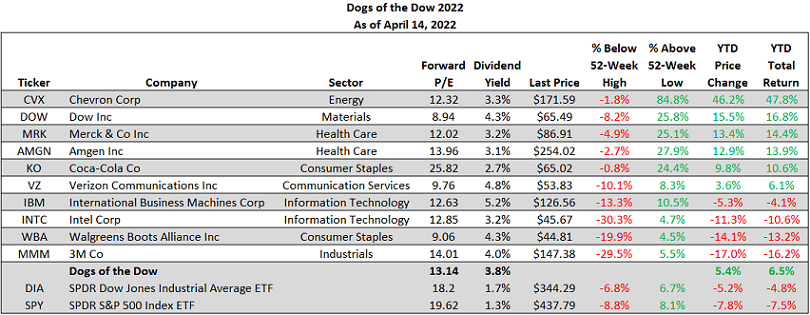
With a little more than a fourth of the year behind investors, and in the face of rising interest rates, dividend paying stocks have been insulated from some of the equity market volatility that has impacted growth stocks. Maybe one of the better known income investment strategies is investing in the Dogs of the Dow. The popularity of the strategy is its singular focus on dividend yield. The Dogs of the Dow strategy is one where investors select the ten stocks that have the highest dividend yield from the stocks in the Dow Jones Industrial Index after the close of business on the last trading day of the year. Once the ten stocks are determined, an investor invests an equal dollar amount in each of the ten stocks and holds them for the entire next year. As the below table shows, the year to date return for the Dow Dogs through April 14, 2022 equals 6.5% versus the Dow Jones Industrial Average ETF (DIA) down -4.8% and the SPDR S&P 500 Index ETF (SPY) down -7.5%. The strategy has had mixed results over the years.
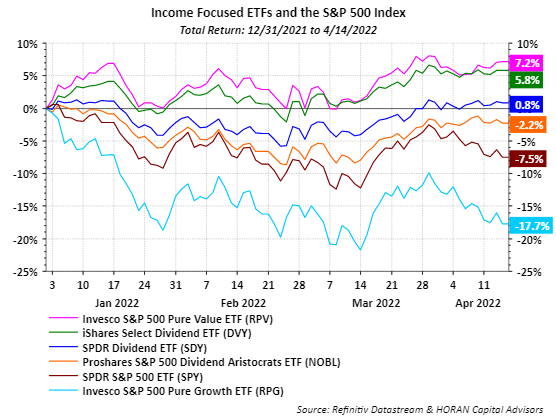
The Dow Dogs' strategy is solely focused on dividend yield and the below chart includes other dividend focused equity strategies. The top four performing strategies are mostly dividend income ones. Each of the top four performing ones are also outperforming the broader S&P 500 Index. The top performing one is the Invesco S&P 500 Pure Value ETF (RPV), up 7.2% and the bottom performing strategy is the Invesco Pure Growth ETF (RPG), down -17.7% year to date. The Pure Value ETF strategy is not a pure dividend focused one, however, out of the 119 stocks in the index, only 12 do not pay a dividend.
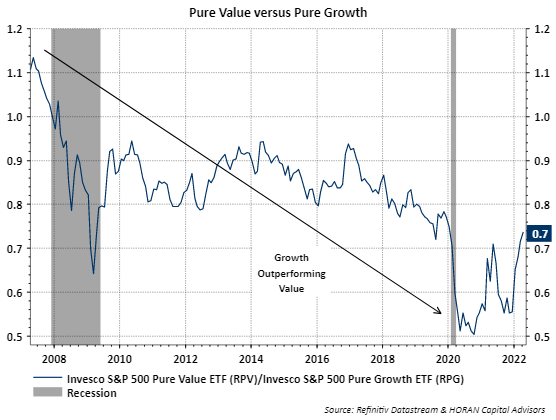
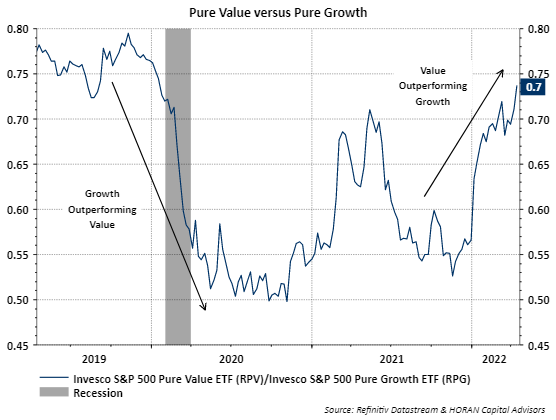
The growth style has mostly outperformed value since the end of the 2008/2009 financial. The first chart below shows this outperformance. The second chart is a shorter three year time frame, and since the pandemic bottom in March of 2020, outperformance has vacillated between growth and value. Again, the value style is outperforming this year.
Contributing to value's outperformance is its overweight in the financial sector, 31% versus 12.5% for growth. The other two outperforming sectors for pure value are Consumer Staples and Materials, with the pure growth style having no exposure to those two sectors. With higher interest rates likely this year, this could serve as more of a benefit for value style stocks versus growth style ones.
Disclosure: Firm/Family long DOW, MRK, VZ, INTC, MMM
HORAN Capital Advisors, LLC is an SEC registered investment advisor. The information herein has been obtained from sources believed to be reliable but we cannot assure its accuracy or completeness. Neither the information nor any opinion expressed constitutes a solicitation for the purchase or sale of any security. Any reference to past performance is not to be implied or construed as a guarantee of future results. Market conditions can vary widely over time and there is always the potential of losing money when investing in securities. HCA and its affiliates do not provide tax, legal or accounting advice. This material has been prepared for informational purposes only and is not intended to provide and should not be relied on for tax, legal or accounting advice. You should consult your own tax, legal and accounting advisors before engaging in any transaction.