
Author: David I. Templeton, CFA, Principal and Portfolio Manager
The S&P 500 Index closed out the week ending July 22 with a gain of 2.57%. Since mid-June the weekly return for the market has alternated between a positive and negative result. During this back and forth though, the Index has been making higher lows followed by higher highs since mid June. This followed my article dated June 21, Might an Equity Market Bottom Be Near, and since that time the Index is up nearly 8%.
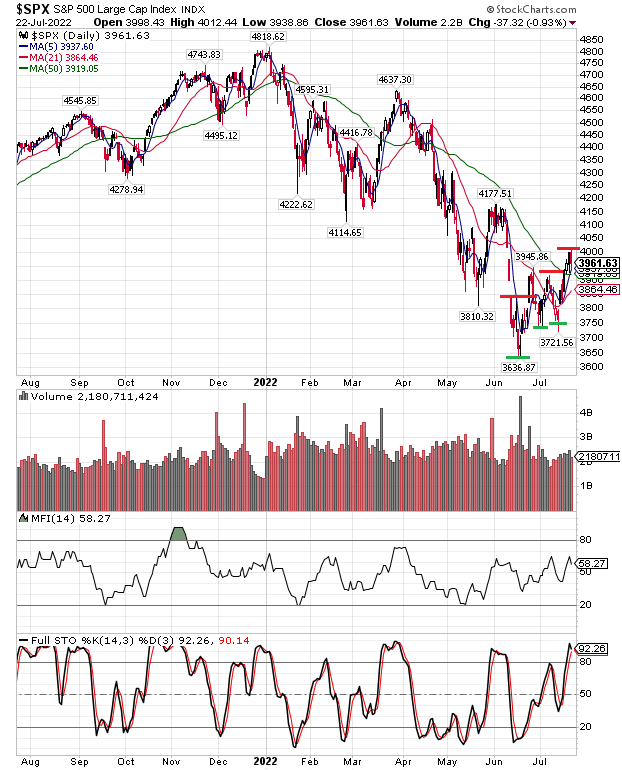
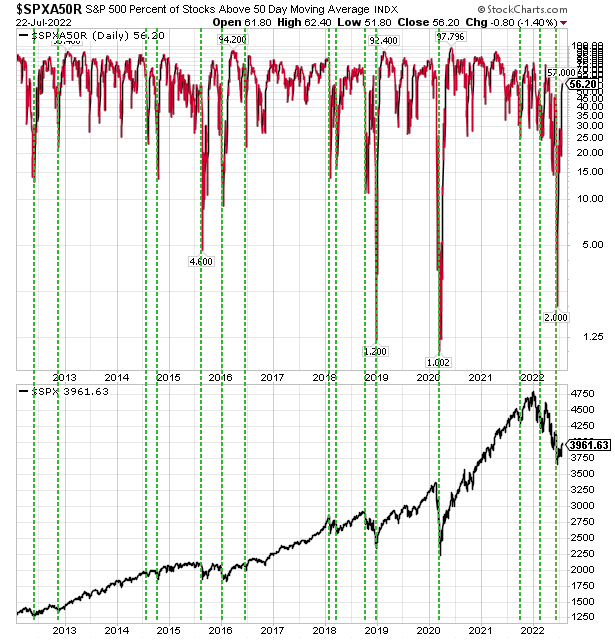
The other observable aspect of the above chart is the fact the S&P 500 Index is now trading above its 50-day moving average. If one reads the earlier article noted above, at the time that article was written, only 2% of S&P 500 stocks were trading above their 50-day moving average. As of Friday's close the percentage has increased to 56% and the S&P 500 Index has increased from 3,674 to 3,961.
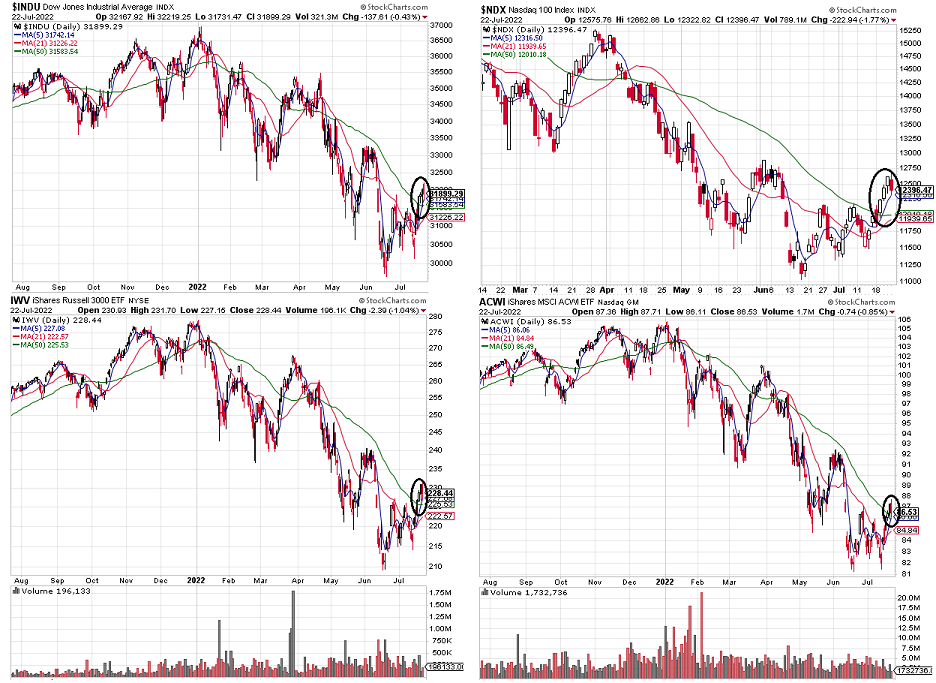
Many other indexes are showing technical improvement as well and are trading above their 50-day moving averages. A few are displayed below. This change in trend is certainly a positive one and is an indication of investors' increased appetite for risk.
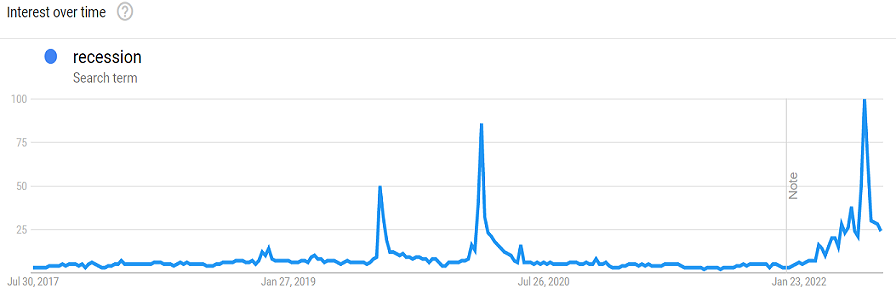
It is nearly impossible not to hear the heightened discussion about the economy headed for a recession. In fact, it is quite possible the economy is already in a technical recession, i.e. two consecutive quarters of negative real GDP growth. With this type of focus and wide spread dissemination about a recession, then the impact of a recession on the market tends to get reflected in asset prices since it is widely known news.
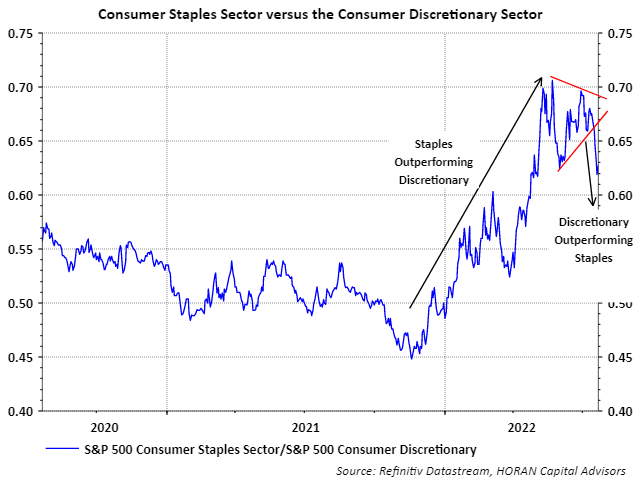
One market segment that tends to do poorly leading up to and into a recession is the consumer discretionary sector. Coming out of a recession though, broadly speaking, discretionary stocks tend to be a leader. Contrast this with the consumer staples sector which tends to be more defensive as companies that comprise the sector tend to sell products consumers need regardless of the economic environment. Since the beginning of this year, the consumer discretionary sector has been one of the worst performing ones, second only to the communication services sector. From the start of the year through mid June, the discretionary sector was down 34.7% versus the consumer staples sector being down 11.2%. Since mid-June though, the more economic sensitive consumer discretionary sector is up 15.4% and consumer staples are up only 6.5%. This outperformance appears to be the beginning of a potentially longer lasting outperformance trend as the blue line on the below chart has broken out of a wedge pattern indicating an outperforming discretionary sector.
The equity market may not be out of the woods yet and does seem a little overbought after being up almost 8% since its June 16 low. Much discussion is taking place about earnings for companies and this being the next shoe to drop and create a headwind for the market as the economy slows. Earnings results are expected from some technology heavy weights this week from the likes of Apple (AAPL), Amazon (AMZN), Alphabet (GOOGL), Meta (META), Microsoft (MSFT) and Intel (INTC) to name just a few. The advance reading on second quarter GDP comes out on Thursday and the Federal Reserve will report a decision about interest rates following the FOMC meeting on Wednesday. For investors though, it hardly feels like a decent market advance over the past month or so given the steady trend lower on most asset classes for most of this year. Nonetheless, the market seems to be attempting to find a bottom at this level.
Disclosure: Firm and/or family long AAPL, GOOGL, INTC, MSFT
HORAN Capital Advisors, LLC is an SEC registered investment advisor. The information herein has been obtained from sources believed to be reliable but we cannot assure its accuracy or completeness. Neither the information nor any opinion expressed constitutes a solicitation for the purchase or sale of any security. Any reference to past performance is not to be implied or construed as a guarantee of future results. Market conditions can vary widely over time and there is always the potential of losing money when investing in securities. HCA and its affiliates do not provide tax, legal or accounting advice. This material has been prepared for informational purposes only and is not intended to provide and should not be relied on for tax, legal or accounting advice. You should consult your own tax, legal and accounting advisors before engaging in any transaction.